
From Financial Chaos to Strategic Clarity
Empowering Your Business Growth Together

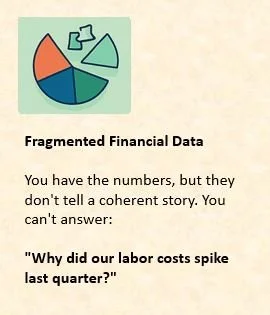
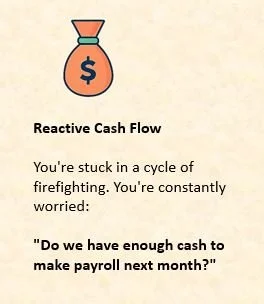
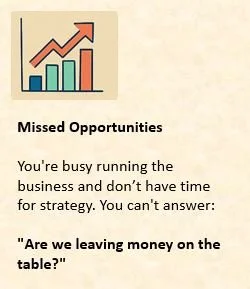
The C-Suite Dilemma
You Can’t Grow What You Can’t Measure
Explore what we offer
Forecasting, Budgeting & Planning
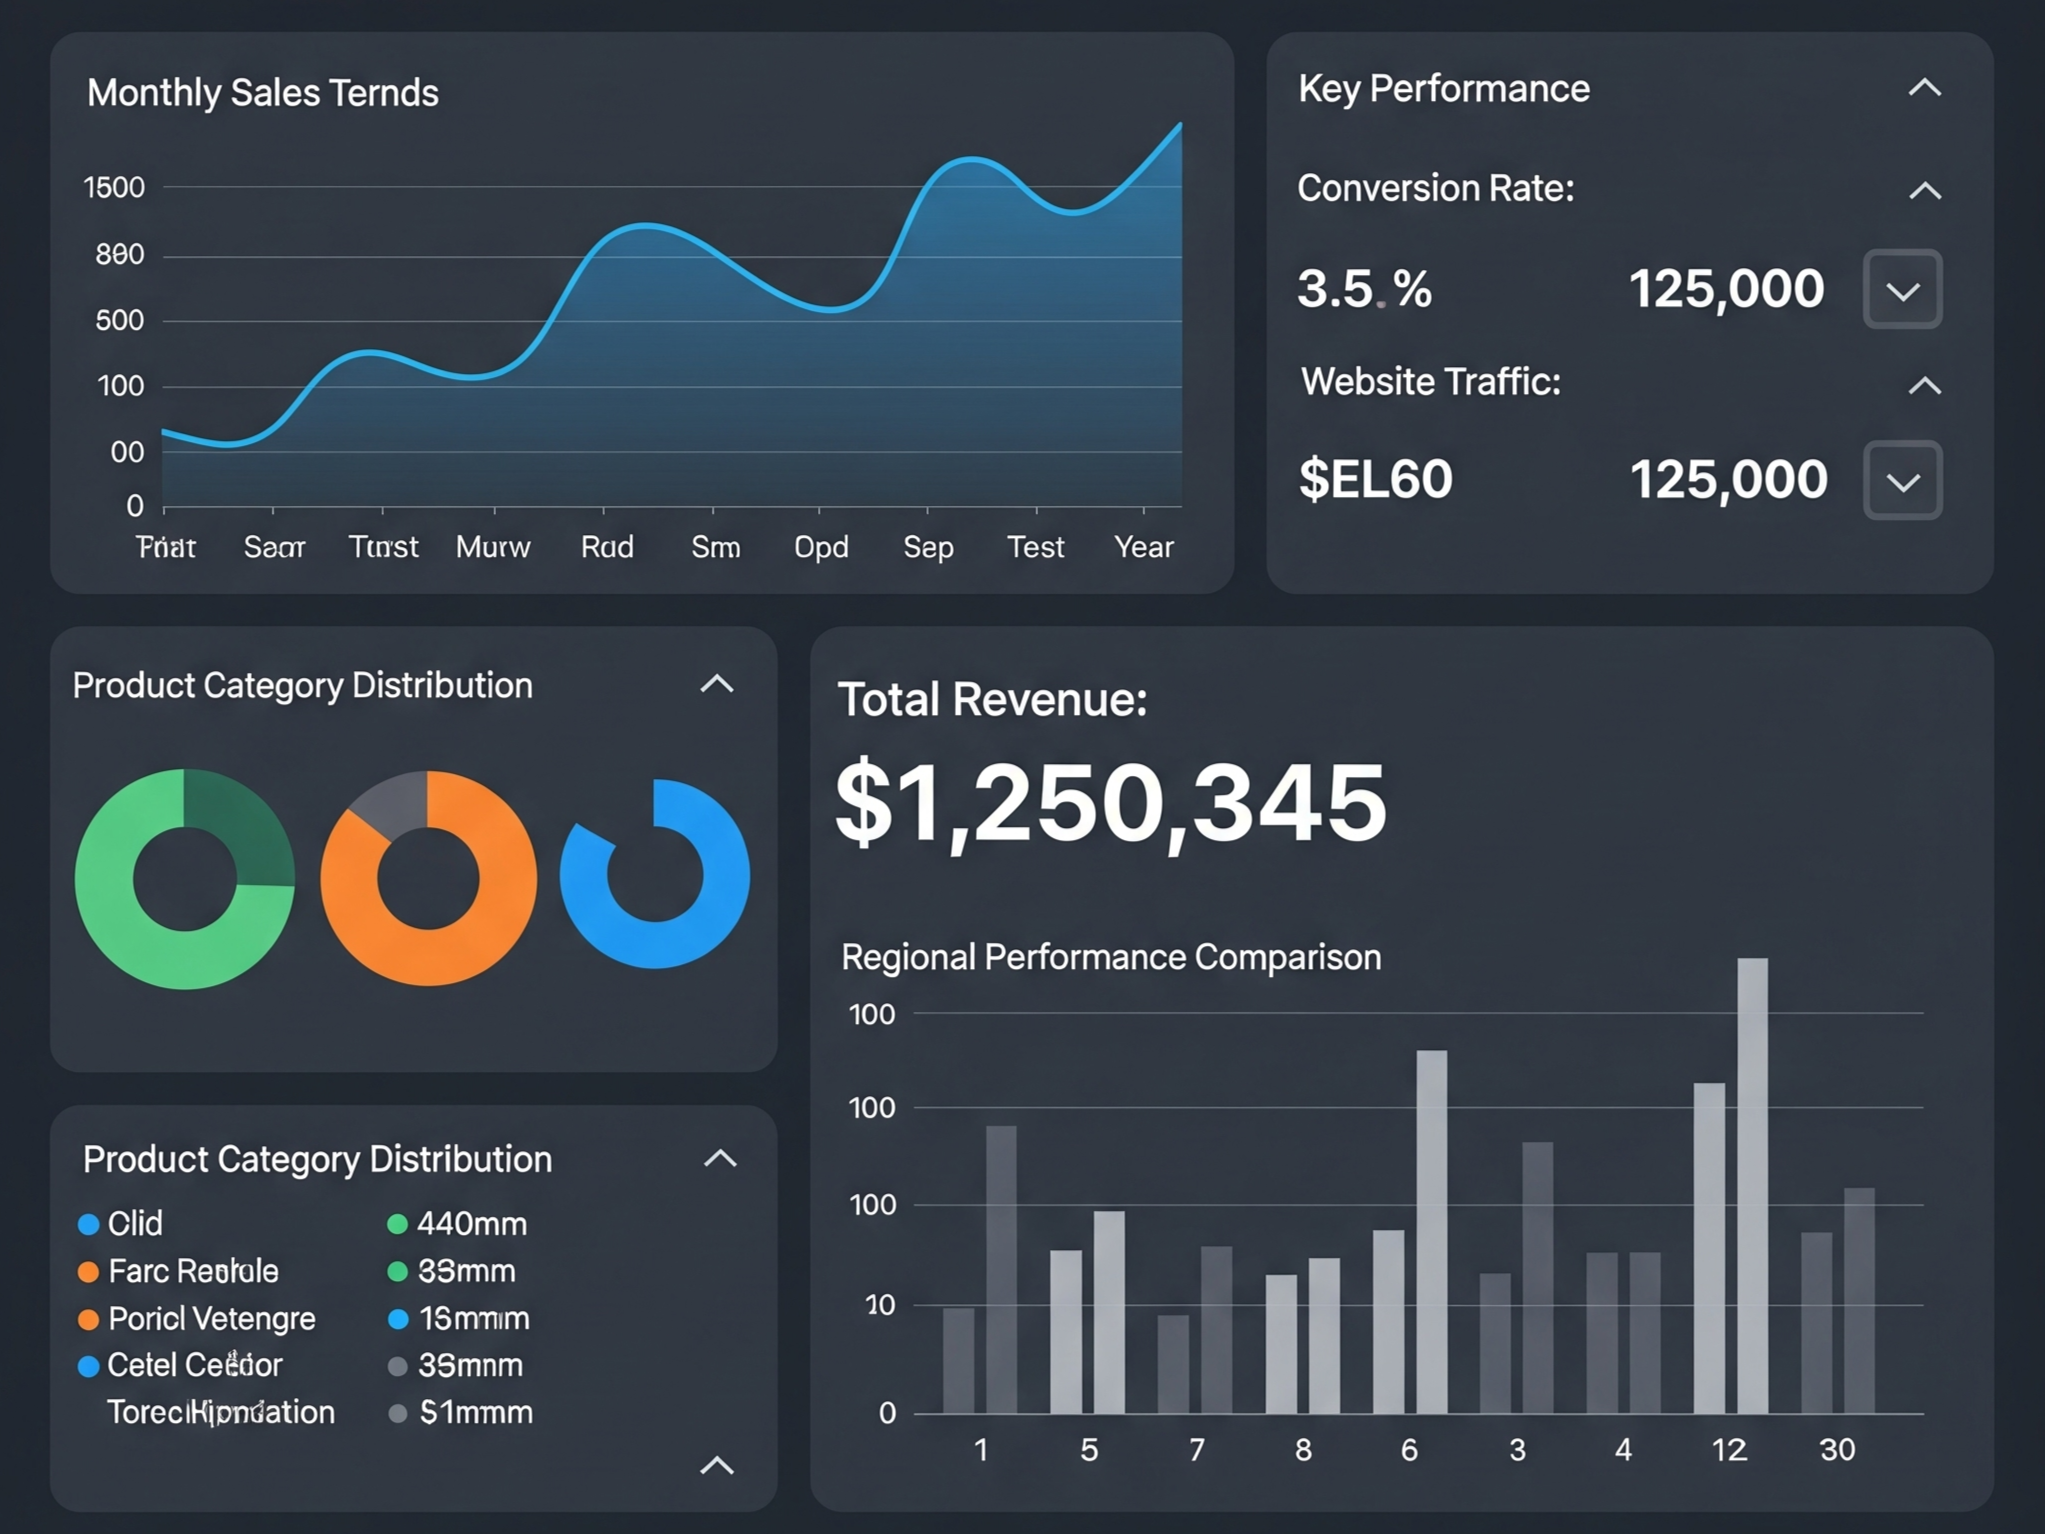
KPI Dashboards & Variance Analysis
30-60-90 SKU & Vendor Aging analysis
Liquidity Modeling, Free Cash Flow analysis
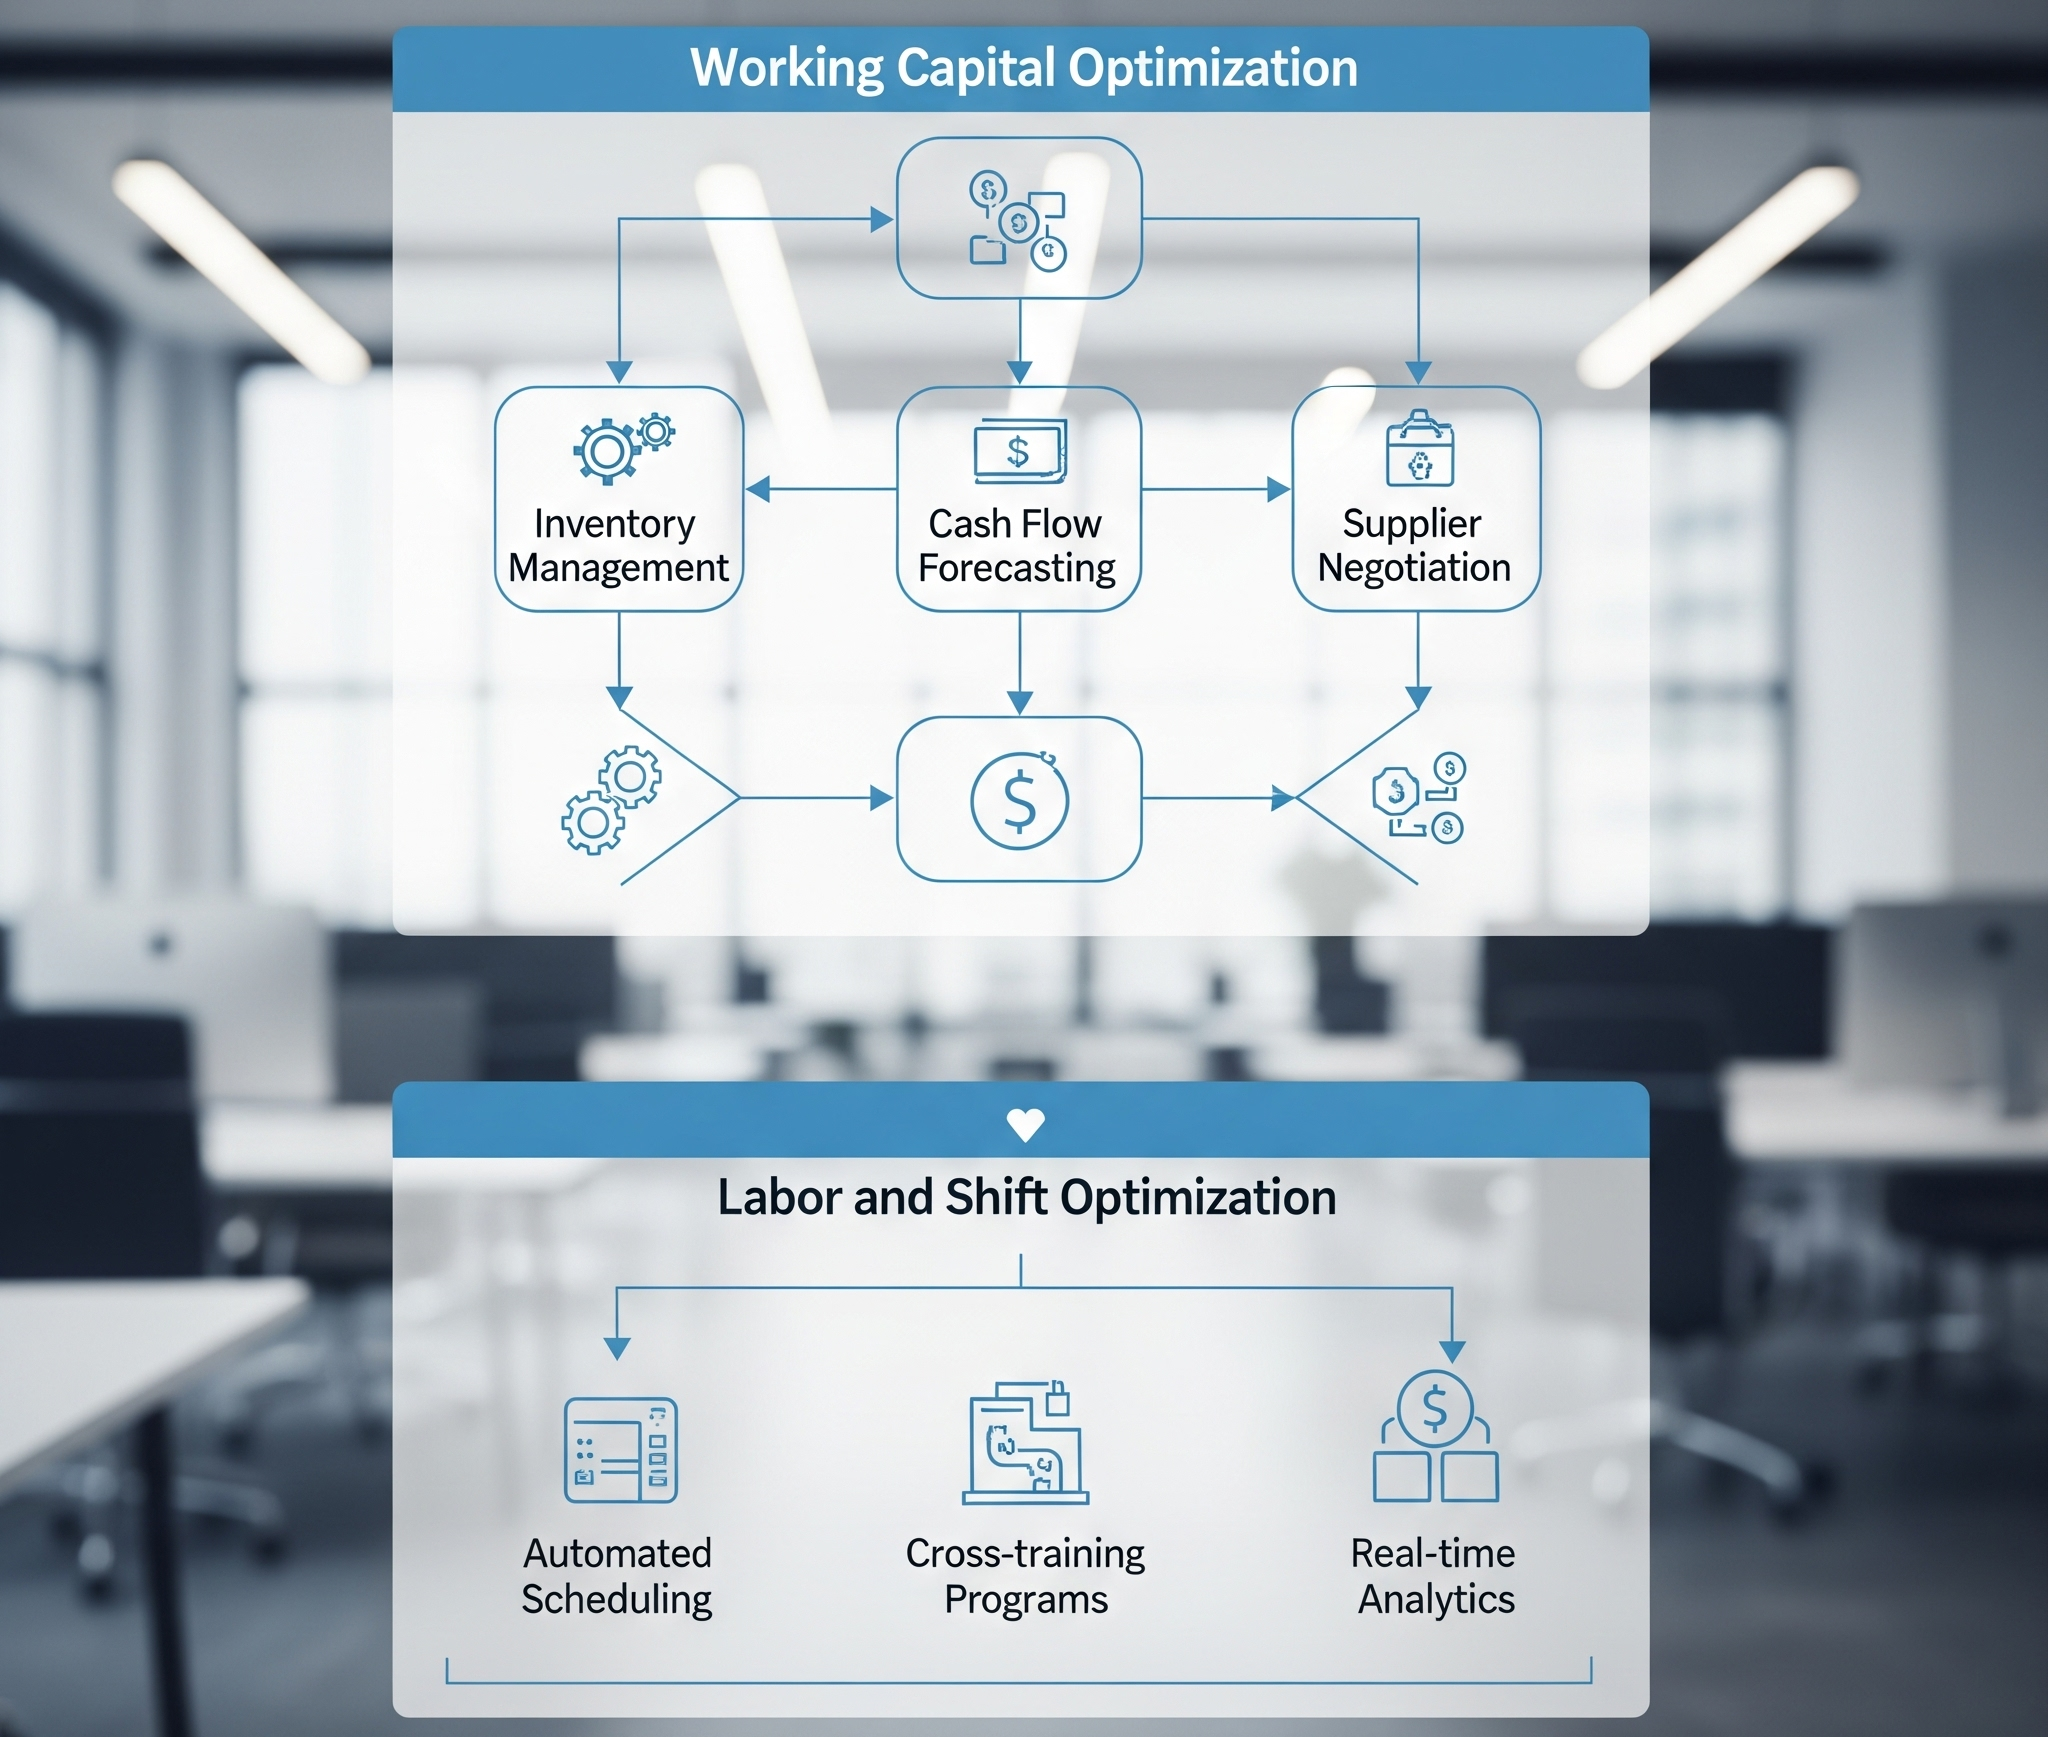
Working Capital Optimization
Vendor & Procurement Audits
Labor & Shift Optimization
Fixed vs. Variable Cost Diagnostics
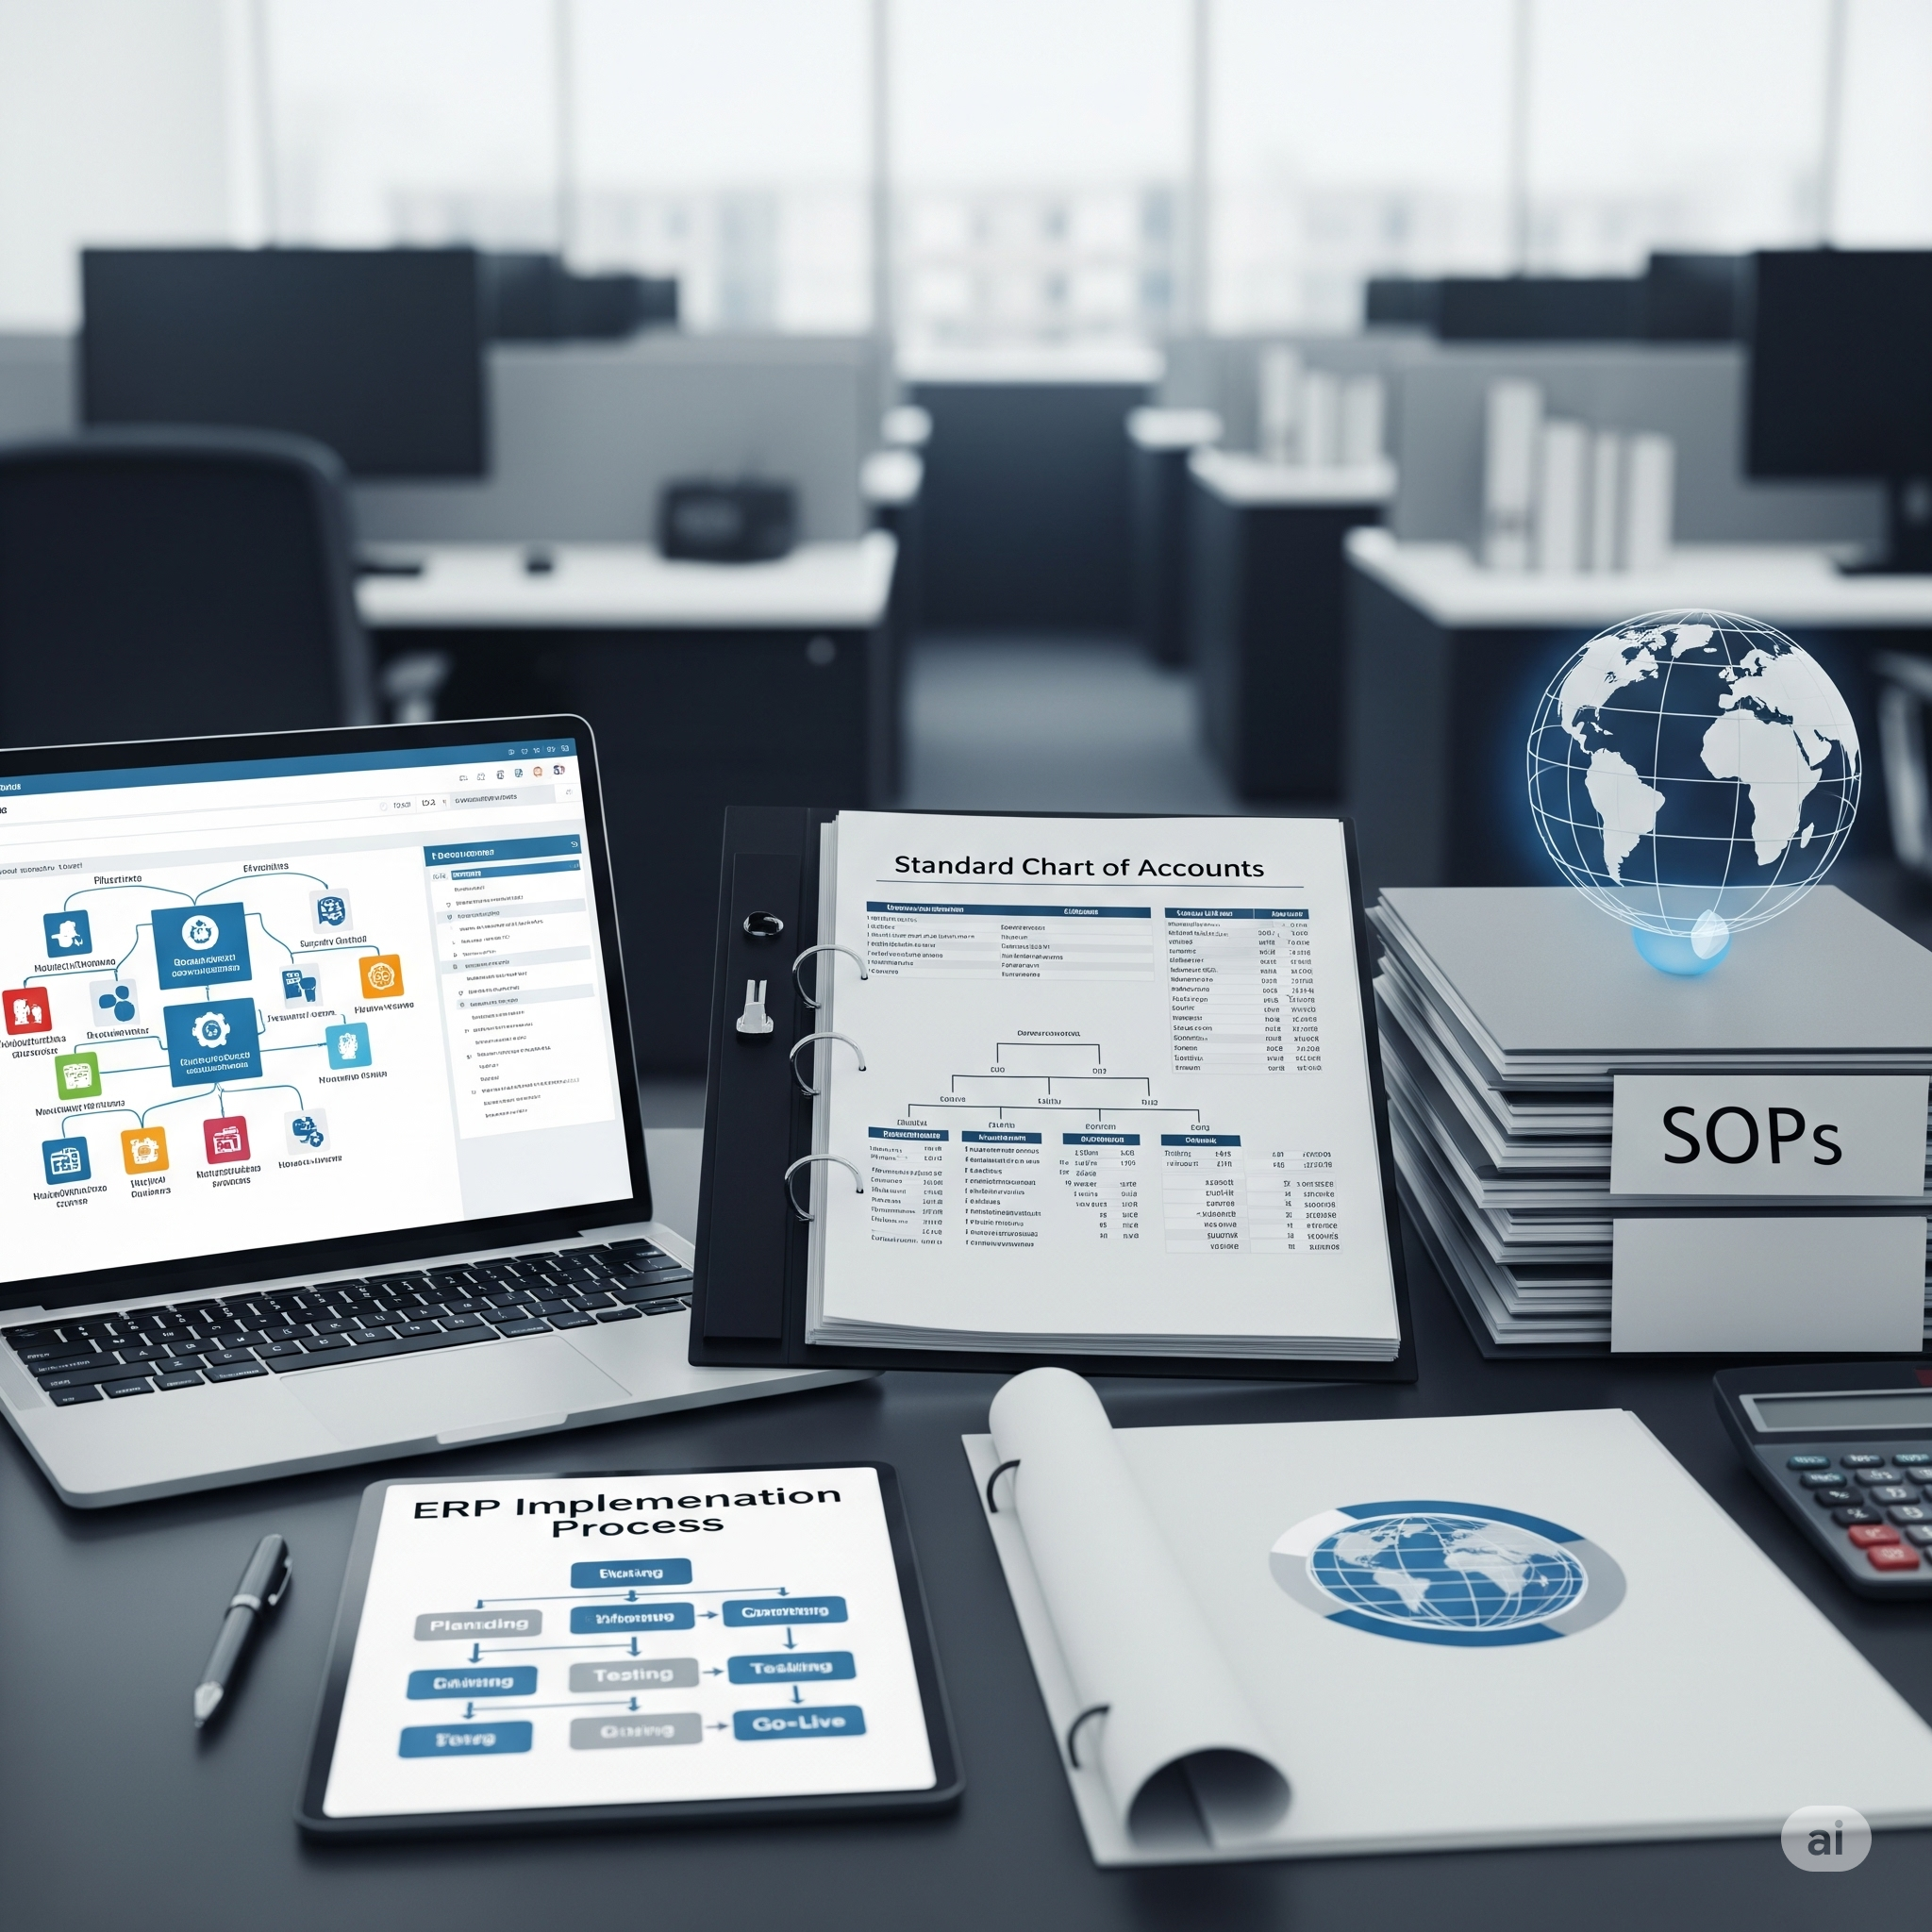
Standard Operating Procedures (SOPs)
Chart of Accounts Standardization
ERP Workflow Design (QuickBook, NetSuite, ODO)
Virtual Shared Services Setup
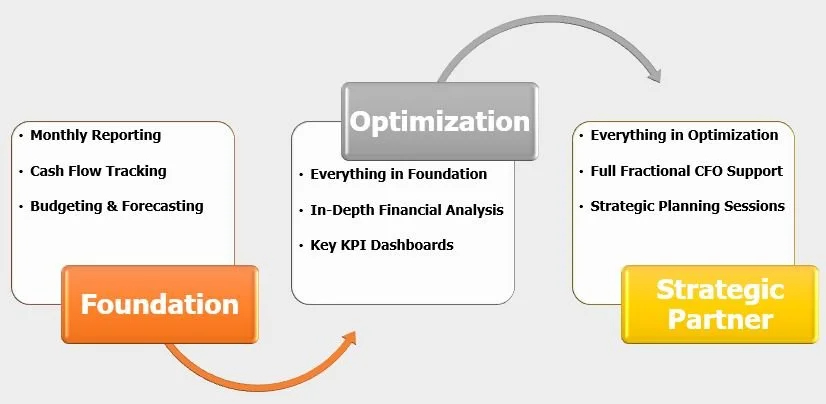
Our Partnership Models
Choose Your Path to Excellence
Why Us?
The Agility of a Boutique, the Rigor of a Global Enterprise
30+ Years of combined expertise
World-class financial discipline across global companies

Proven Impact
over $10MM+ in cost optimization and FCF improvement across various projects
Fractional Value
CFO-level insights without the full-time cost
Outcome Oriented
Focused on measurable results
Our Track Record
Real Results. Not just Reports
Delivered strategic margin and cost analysis leading to vendor contract renegotiation yielding $2.6MM in savings
3-way match controls unlocking $1MM+ in annual savings
Asset utilization optimization leading to $0.75MM savings
Strategic financial analysis on proposed network capacity expansion enabled $0.4MM in annualized cost avoidance
Automating close procedures and reducing process time by 25%
Improved the FCF position by $2.5MM
AR / AP analysis improving cashflow cycle time by 15 days
Accelerating cash‑flow cycles
Improving working‑capital turns
Set up a complimentary chat

Ready to take the next step in achieving your business goals? Scheduling a consulting session with us is as easy as a few clicks—let's start your journey to success today!
We promise to give you one actionable insight you can use immediately!
Our Process
Your Path to Financial Clarity
Step-1 Free Discovery Call
Step-2 Cost & Opportunity Diagnostics
Step-3 Tailored Partnership Kickoff